
Limescale Challenges in Montgomery County's 112TRRC Aquifer: Assessing Industrial Water Needs
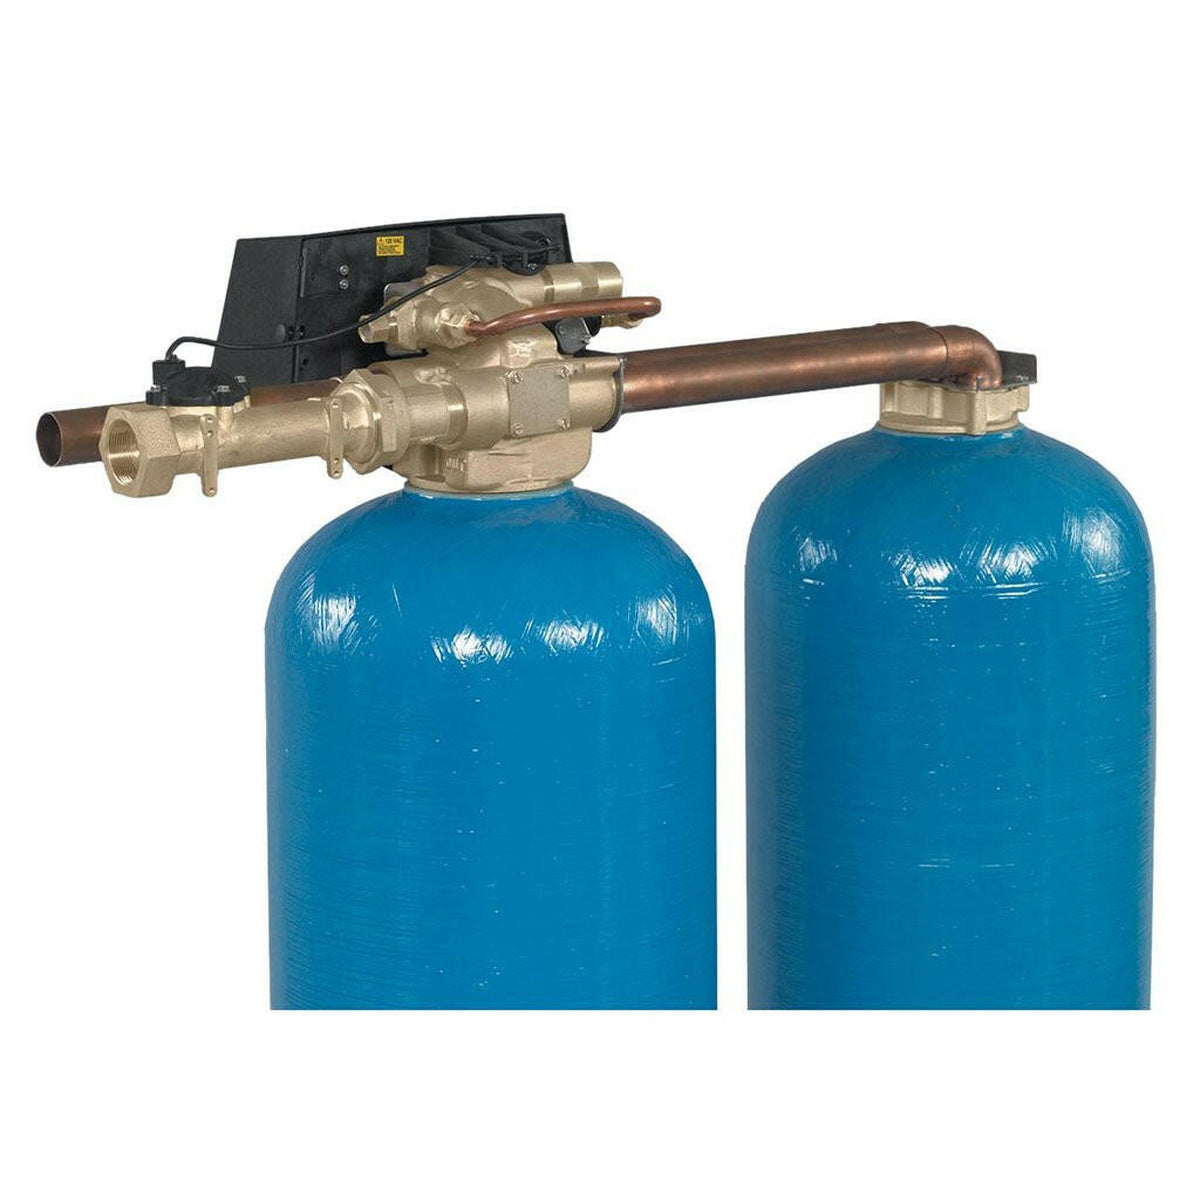
Pricing: request a quote
Get a QuoteFleck Industrial 150,000 Grain Commercial Water Softener
✓ Free shipping in the USA · ✓ 90-day returns · ✓ Secure checkout

Understanding Laboratory Testing for Calcium and Magnesium in Aquifer Water
Certified labs report concentrations of calcium and magnesium separately, typically in milligrams per liter (mg/L).
These analyses indicate the quantities dissolved in groundwater drawn from wells, not at consumer taps.
Result values fall within a range where no federal health thresholds were exceeded in Montgomery County's 112TRRC aquifer samples.
Median values from 2011-2012 sampling showed about 12.85 mg/L total for calcium plus magnesium combined.
Such tests do not provide definitive information about any single well's conditions without sampling it directly.
Initial Fixtures and Processes to Monitor for Limescale Effects
Hot water heaters often reveal limescale buildup earlier due to temperature-driven mineral precipitation.
Industrial boilers and cooling towers experience scaling that reduces heat transfer efficiency and increases maintenance.
Small orifices, valves, and nozzles in process equipment can clog or degrade performance from mineral deposits.
Surfaces in contact with water, such as heat exchangers or pipelines, may develop visible scale if untreated.
Symptoms Actually Linked to Limescale Versus Other Water Quality Issues
Whitish, hard deposits on fixtures and equipment surfaces are common indicators of mineral scaling.
Declining efficiency or increased energy use in heating equipment often signals buildup consistent with limescale presence.
Water discoloration or odor changes generally do not result from calcium and magnesium levels.
Frequent equipment breakdowns may have multiple causes; limescale should be confirmed through testing before assumptions.
Comparing Montgomery County’s Water Records With Those of Neighboring Areas
Montgomery County samples show a moderate range of dissolved calcium and magnesium compared to adjacent counties.
Differences in well depth and geologic formations can affect water composition regionally.
Data from a neighboring aquifer with higher mineral content doesn’t imply the same conditions here.
Direct sampling is necessary to evaluate a specific facility’s water before equipment decisions.
Reading the Reported Median and Range as an Industrial Operator
The median total dissolved calcium plus magnesium near 12.85 mg/L indicates moderate mineral presence.
The observed range from 5.39 to 24.7 mg/L reflects natural variability across various wells sampled.
None of these concentrations exceed federal thresholds for drinking water safety but do affect scaling potential.
Understanding this range helps plan equipment capacity and treatment needs appropriately.
Stepwise Actions From Simple Checks to Laboratory Confirmation
Begin with visual inspection of equipment for scale deposits during routine maintenance.
Monitor process performance parameters such as heat transfer rates and flow restrictions.
Collect water samples from supply points for certified laboratory analysis of calcium and magnesium.
Use laboratory results alongside process data to evaluate treatment system sizing and technology choices.
For industrial demands encountering limescale challenges in Montgomery County’s 112TRRC aquifer, the documented solution to consider is the 21&24 Fiberglass Tanks - Twin Unit Ski commercial system skid. It ships ready to configure and is designed to handle varying hardness levels consistent with this region’s water composition and industrial usage patterns.
Where this information comes from
Source: USGS groundwater sampling. Sampled 2012-07-16. These figures describe groundwater sampled in this area. They are not a test of any individual private well - only a test of that well can establish its own water.
On record: U.S. Geological Survey sampling of Hardness, Ca, Mg in the 112TRRC aquifer (Montgomery County): 8 results from 6 wells, median 12.85 mg/L, range 5.39-24.7 mg/L; none above any federal threshold