
Limescale in Finney County Water: Understanding Local Aquifer Data for Residential Choices
$900.00
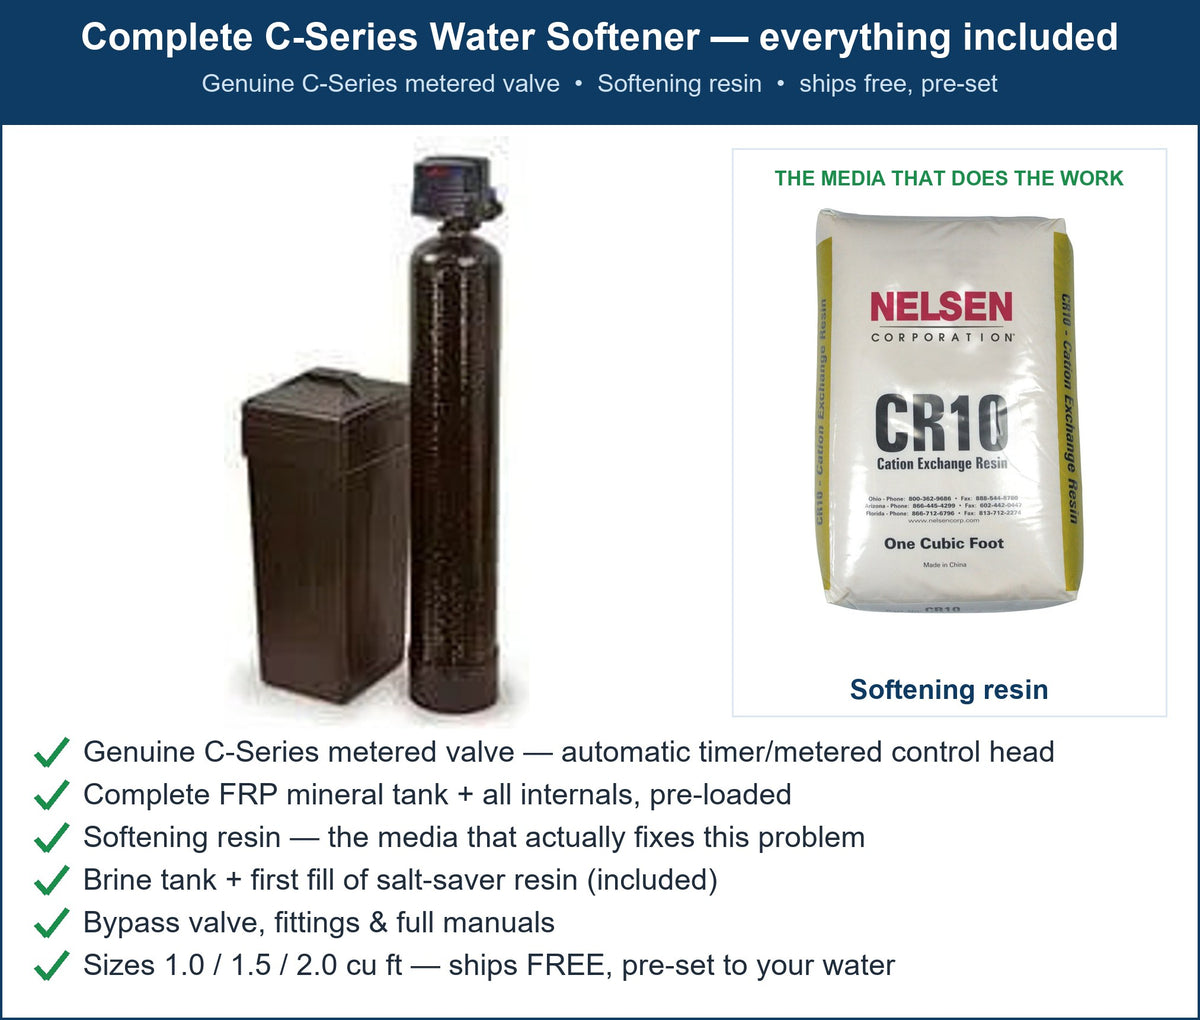
C-Series Limescale & Scale Buildup System
✓ Free shipping in the USA · ✓ 90-day returns · ✓ Secure checkout

Government sampling in Finney County’s aquifer 121OGLL shows hardness-related minerals detected in all tested wells, with a median concentration of 389.0 mg/L and a range from 377.0 to 405.0 mg/L based on three samples from one well taken between 2010 and 2021. These figures represent an area-wide assessment, not measurements specific to any single household well.
How many samples and wells stand behind the figures, and what a small sample means
The data comes from one well sampled three times over an 11-year span. This sample size is quite limited for the entire Finney County aquifer 121OGLL area, meaning the numbers provide a preliminary indication rather than a comprehensive profile. The single sampling site was about 65 feet deep, but aquifer conditions can vary locally. More wells and samples would be necessary to fully map regional variability.
What 'detected', 'median,' and 'range' mean in the sampling record on this page
'Detected' means that instruments measured hardness-related constituents—primarily calcium and magnesium—in every sample. The 'median' is the midpoint of measured values, and the 'range' shows the minimum and maximum concentrations found. Detection does not imply any problem or violation, only presence. The measured range here is relatively narrow, indicating limited variation within the sampled well over time.
How to compare this area's record with a neighbouring county's without overreading it
When comparing Finney County’s data with adjacent areas, consider that the limited number of samples restricts definitive conclusions. Neighboring counties may show different median or range values due to geological differences. Such comparisons should inform awareness of regional trends but not define any individual water source’s condition without direct testing.
How seasonal or multi-year variation shows in the record (dates and ranges given)
The samples span from March 2010 to March 2021, covering multiple years and seasons. The narrow range between 377.0 and 405.0 mg/L suggests relative stability over time at that location. However, seasonal variations can occur elsewhere due to factors like rainfall or groundwater recharge. Area data alone cannot predict short-term fluctuations in any well.
What changes for a large household, a second home, or a seasonal property
Household water usage patterns influence how limescale builds up but do not affect the water’s hardness itself. A large family or high water demand may experience more noticeable scale buildup on appliances and fixtures. Second homes or seasonal properties with low or intermittent use might see different scaling patterns due to water sitting longer in pipes. Treatment approaches should consider these use differences.
What the measured range means against the relevant federal standard, and what it does not mean
None of the sampled results exceed any federal health-based standard for groundwater. The concentrations here relate mainly to aesthetics such as taste and scale formation potential, not safety. Exceeding aesthetic thresholds does not signify unsafe water but may cause limescale buildup, which can affect plumbing and appliance function over time.
To understand your specific household water quality and scaling risk, have your water independently tested for hardness, calcium, and magnesium. The results will inform if the C-Series Limescale & Scale Buildup System is an appropriate solution to reduce scale buildup in your home. This equipment ships ready to configure and addresses mineral scale without altering the water’s safety or compliance status.
Where this information comes from
Source: USGS groundwater sampling. Sampled 2021-03-30. These figures describe groundwater sampled in this area. They are not a test of any individual private well - only a test of that well can establish its own water.
On record: U.S. Geological Survey sampling of Hardness, Ca, Mg in the 121OGLL aquifer (Finney County): 3 results from 1 wells, median 389.0 mg/L, range 377.0-405.0 mg/L; none above any federal threshold